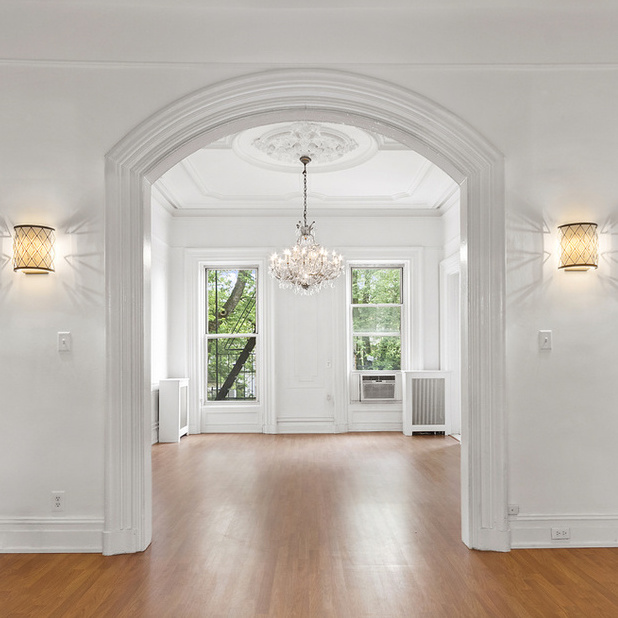
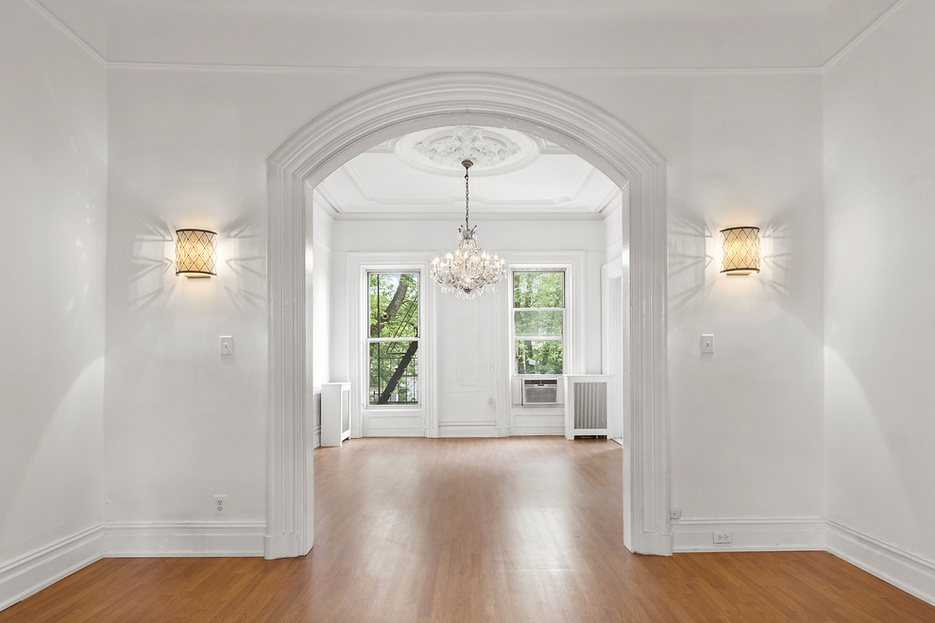
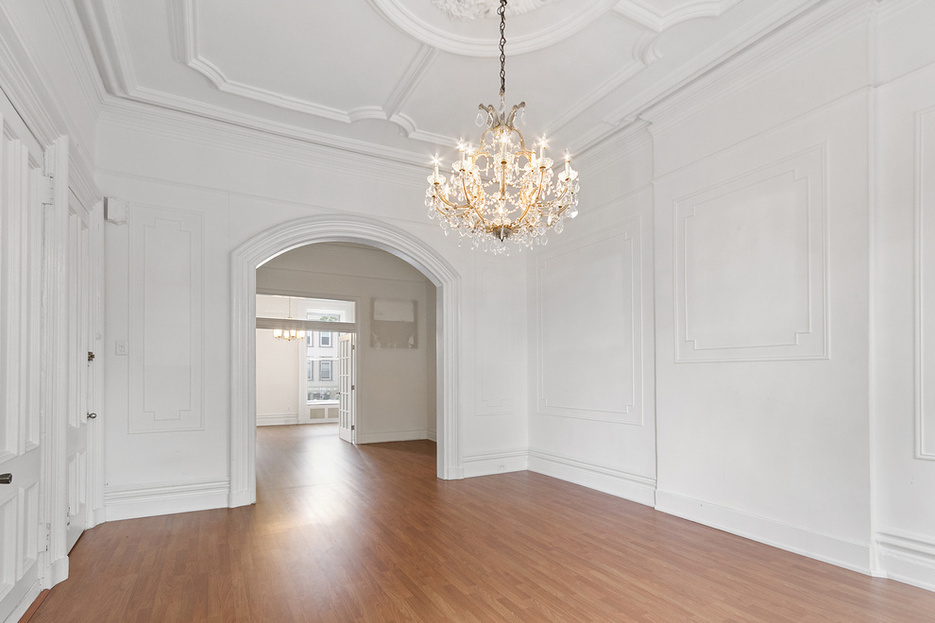
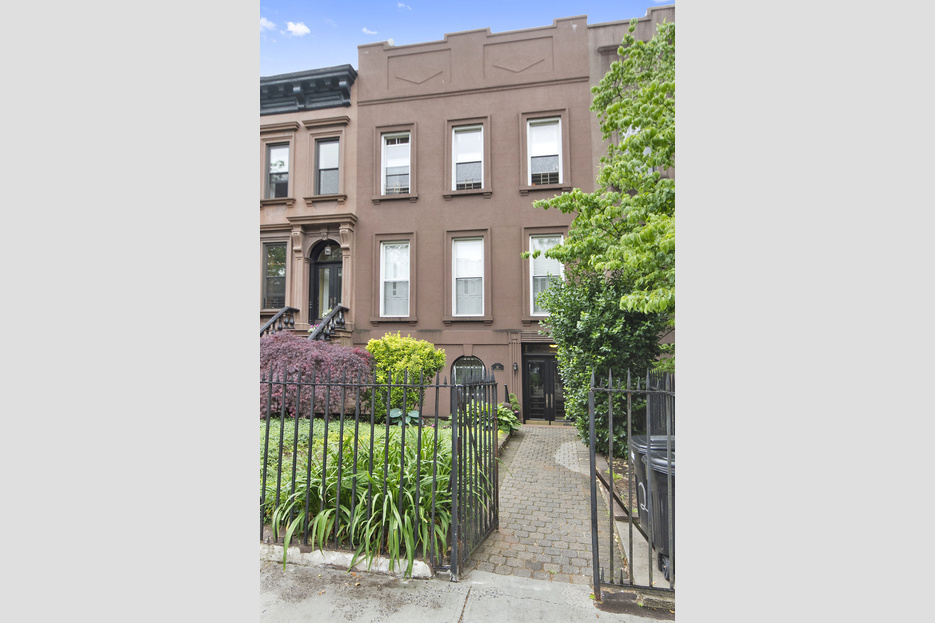
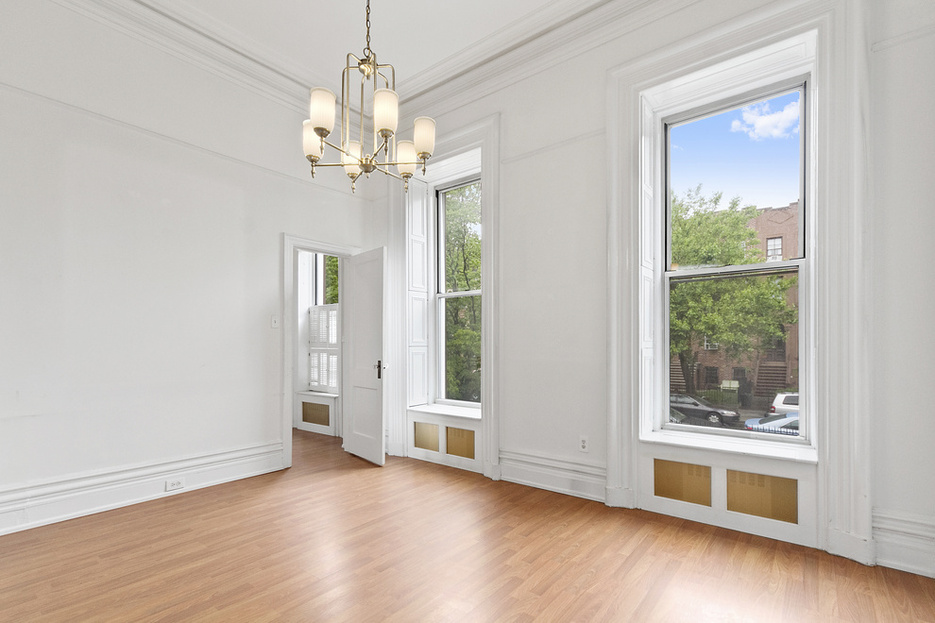
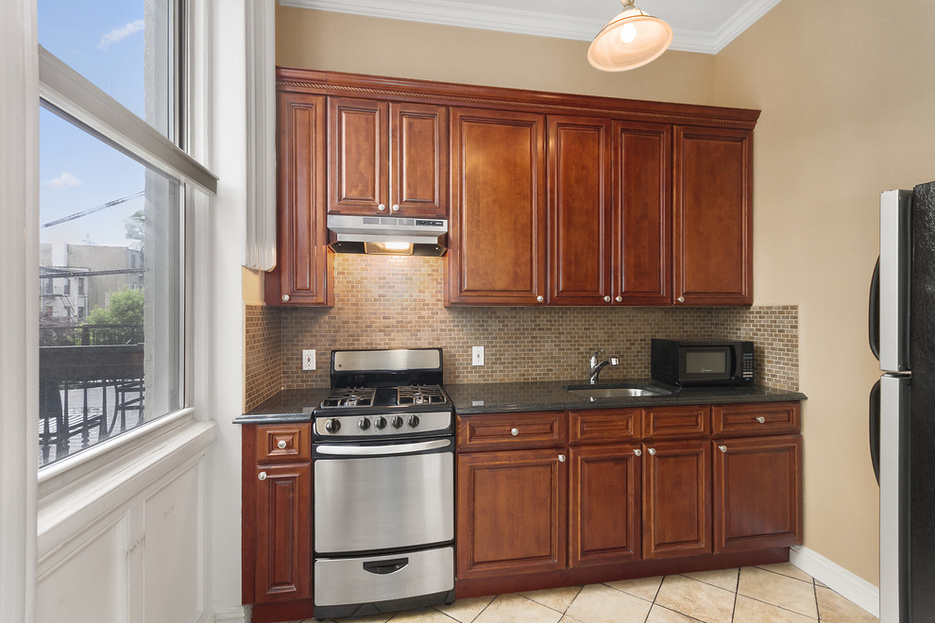
Gorgeous original details abound in this large 2BR. This is a rare 25 foot wide Carroll Gardens mansion on a lovely Place Street. Incredible moldings and 13 foot ceilings give this parlor floor great light and space. The large kitchen with cherry wood cabinets, granite counter top and stainless steel appliances makes cooking easy! Spacious center living room with French doors lead into a king size bedroom with custom shutters and two custom built closets. A spacious side room with oversized window completes this perfect Brooklyn home. Bathroom is brand new too. Heat and hot water are included and a window A/C is also provided. Zoned for PS 58.
Two blocks to the F/G train. Near Frankies 457, Buttermilk Channel, Prime Meats, Caputo’s and all the great shops of Carroll Gardens.
Average price of single-family house plunges 13%, or by C$160,000 from peak. Sales of homes priced over C$1.5 million collapse by 63%. Condos still hanging on.
Housing in the Greater Toronto Area is, let’s say, retrenching. Canada’s largest housing market has seen an enormous two-decade surge in prices that culminated in utter craziness in April 2017, when the Home Price Index had skyrocketed 32% from a year earlier. But now the hangover has set in and the bubble isn’t fun anymore.
Home sales plunged 22% in May compared to a year ago, to 7,834 homes, according to the Toronto Real Estate Board (TREB). It affected all types of homes, even the once red-hot condos:
Detached houses -28.5%
Semi-detached houses -29.4%
Townhouses -13.4%
Condos -15.5%.
It was particularly unpleasant at the higher end: Sales of homes costing C$1.5 million or more plummeted by 46% year-over-year to 508 homes in May 2018, according to TREB data. Compared to the April 2017 peak of 1,362 sales in that price range, sales in May collapsed by 63%.
But it’s not just at the high end. At the low end too. In May, sales of homes below C$500,000 – about 68% of them were condos – fell by 36% year-over-year to 5,253 homes.
The TREB publishes two types of prices – the average price and its proprietary MLS Home Price Index based on a “composite benchmark home.” Both fell in May compared to a year ago.
The average price in May for the Greater Toronto Area (GTA) fell 6.6% year-over-year to C$805,320, and is now down 12.3%, or an ear-ringing C$113,000, from the crazy peak in April 2017.
There are no perfect measures of home prices in a market. Each has its own drawbacks. Average home prices can be impacted by the mix and by a few large outliers – but over the longer term, it gives a good impression of the direction. The chart below shows the percentage change in average home prices in the GTA compared to a year earlier:
Wolf Street
The TREB’s proprietary Home Price Index is based on a “composite benchmark home” and strips out the impact of changes in mix and large outliers that may afflict the average price. And the HPI Composite Benchmark fell by 5.4% year-over-year.
All home types except condos experienced year-over-year price declines in the HPI, with detached homes also getting hit the hardest:
Detached houses: -10.2%
Semi-detached houses: -8.5%
Townhouses: -4.3%
Condos: +8.3%
The inventory of homes for sale rose by 13.2% in May compared to a year ago, to 20,919 active listings. At the rate of sales in May, this worked out to a supply of 2.7 months, up from 2.3 months in April and from 2.1 months in March. The average days-on-the-market before the home was sold or before the listing was pulled without sale jumped to 20 days in May from 11 days a year ago.
With some irony, the TREB cited a survey, conducted between May 18 and May 22 in the GTA, that found that concerns about “affordability” — surprise, surprise! — ranked high among a lot of people:
Among 9 listed issues (health care, government spending/balancing budget, taxes, housing affordability, energy costs, economy, transportation/traffic, environment/climate change, enhancing social programs), 25% of GTA residents rank housing affordability in their top two most-important issues for the Ontario election campaign;
69% agree (35% strongly/34% somewhat) that a party’s platform on housing affordability will influence who they vote for on election day.
The irony is that “housing affordability” is fundamentally impacted by prices and interest rates. Interest rates have come up a tiny bit from historic lows and remain historically low. But prices have surged for two decades. What will make the Toronto housing market more affordable for many people would be a substantial decline in prices. So if the TREB wants to enhance housing affordability for folks in Toronto, it should advocate for policies that will bring down home prices – of the kind that the government has been implementing – and not advocate against them. But advocating against them is precisely what the TREB, as real estate lobbying group, has been doing with a passion for a year.
Chicago’s rents are in free-fall, Washington DC’s rent suddenly plunge, New York’s rents fall to third place. But rents soar in Southern California and other parts. Bay Area and Seattle are “mixed.”